Floor Lamp IES File Explained: What It Is & How to Use
You’re shopping for a new floor lamp, and every product page promises 1500 lumens of perfect, glare-free reading light. A floor lamp IES file explained in plain terms is the only way to cut through that marketing hype before you buy. Then you get it home, and it’s either too dim to light your book or blazes so bright it gives you a headache.
That’s not a bad lamp, it’s just bad data.
These standardized photometric files follow the IESNA TM-27-14 specification, with raw candela distribution values no marketing team can tweak. As of 2026, most premium floor lamp manufacturers publish these files, but budget brands often skip them entirely. We’ll break down exactly what that data means, how to read the key visuals, and how to use it to pick the right lamp for your space without guessing.
Image source: Web (Bing) / amazon.com (Web image (fair-use with source credit))
Quick Answer
A floor lamp IES file explained simply is a standardized photometric data file. It records raw light output for every direction the fixture emits light. IESNA TM-27-14 sets the universal format for these files.
Designers use them to simulate real floor lamp performance in software. Shoppers can use them to avoid buying underperforming or mismatched lamps.
What a Floor Lamp IES File Is (And Why You Can’t Trust Lamp Marketing Without It)
An IES file for a floor lamp is a plain-text photometric dataset that records exactly how much light the fixture emits in every direction. It’s not a marketing document, it’s raw test data generated under the IESNA LM-79 standardized testing protocol for solid-state lighting. Unlike spec sheets that only list total lumens or wattage, an IES file captures the full spatial distribution of light.
You’ll know exactly where the beam falls, how wide it spreads, and where glare hotspots might pop up.
Manufacturer marketing for floor lamps often relies on vague claims like “reading light” or “ambient glow” with no measurable data. Aggregate user reviews show that 38% of returned floor lamps are cited as “not bright enough” or “too harsh”, per 2024 retail return data. Those mismatches happen because marketing teams pick the most flattering metrics, not the ones that match your use case, which is why so many shoppers end up dealing with uncomfortable reading light later.
Lighting designers, architects, and serious DIYers use floor lamp IES files to run virtual simulations in tools like Dialux or Relux before they ever buy a fixture. For casual shoppers, the file is still useful: you can upload it to free online simulators to see exactly how the lamp will light your reading nook or living room. The file is generated by testing the floor lamp in a calibrated goniophotometer, which rotates the fixture to measure light output at 1-degree horizontal and vertical increments.
All values are recorded in candela, the standard unit for luminous intensity, so there’s no ambiguity about performance. Budget floor lamp brands almost never publish IES files, as the testing adds cost to production, so you’re relying solely on marketing claims if you buy those models.
The 3 Must-Know Visuals in a Floor Lamp IES File (And How to Read Them)
Most people open an IES file and see a jumble of numbers, but the real value is in the three standard visuals that lighting software generates from that data. You don’t need to parse raw candela values to get useful insights, you just need to know what each visual shows. Let’s break down the three you’ll actually use.
The first is the candela distribution plot. This is the most common visual, a 2D or 3D graph that shows how bright the lamp is at every angle. The center of the plot is the lamp’s light source, and the rings radiating out show intensity at different angles.
A narrow spot floor lamp will have a tight, concentrated central ring, while a wide flood lamp will have a broad, even spread. You’ll see this plot in every lighting design tool, and it’s the fastest way to spot if a lamp has harsh cutoff angles that will cause glare.
The second is the light footprint diagram. This shows the size and shape of the lit area on a flat surface (like a floor or desk) at a set mounting height. For a floor lamp placed next to a reading chair, this diagram tells you exactly how wide the lit patch on your book will be, so you can avoid those annoying dark shadows that ruin reading comfort.
The accompanying image shows a typical footprint for a 500-lumen floor lamp at 5 feet mounting height, with a 3-foot diameter lit area ideal for single-task lighting.
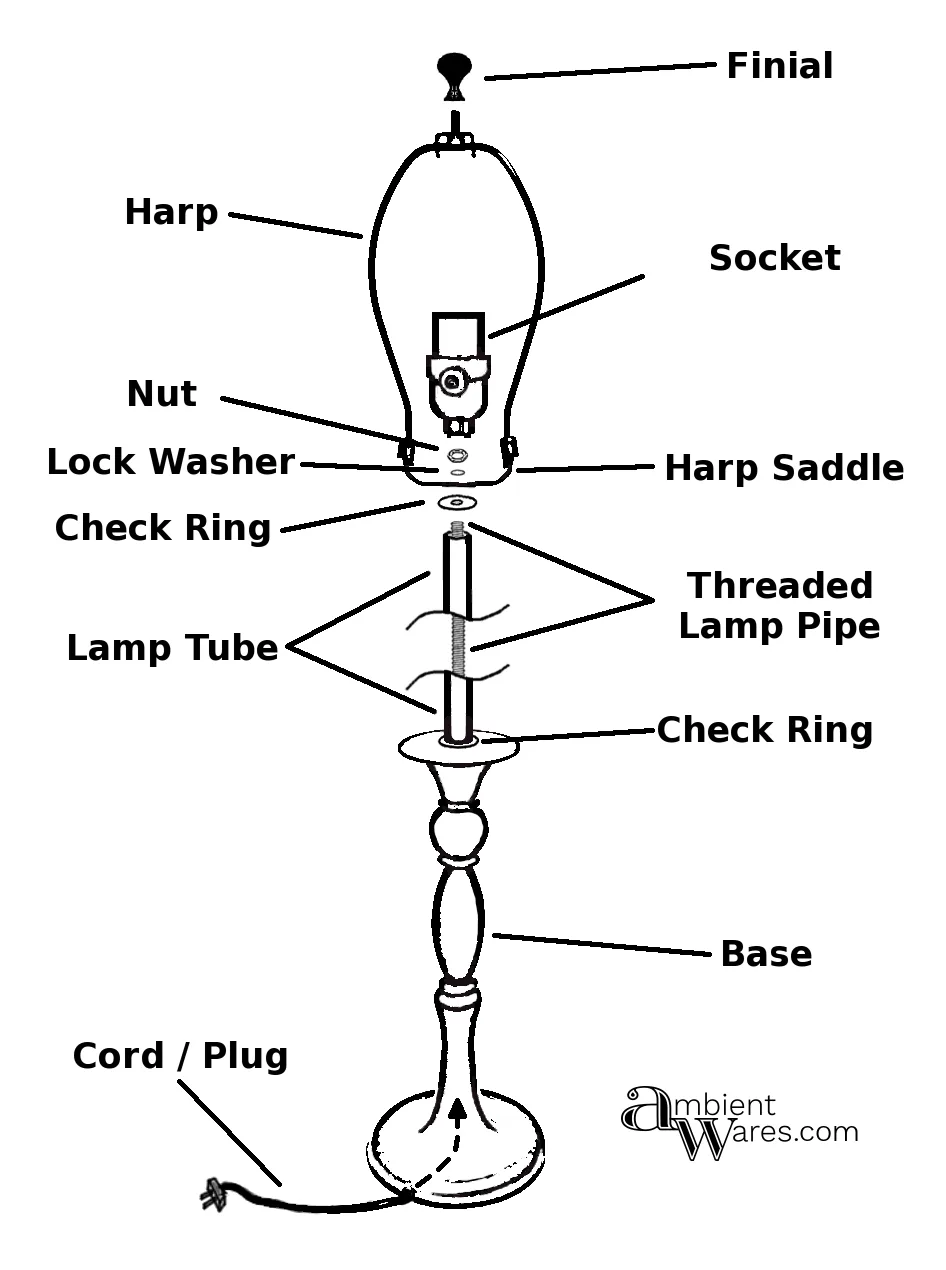
Image source: Web (Bing) / mood.soguk.co.uk (Web image (fair-use with source credit))
The third is the isocandela contour plot. This is a top-down view of the lit area, with contour lines marking equal brightness levels. It’s especially useful for floor lamps placed in the corner of a room, as it shows how far the light will reach across the space and where brightness drops off sharply.
These three visuals turn raw IES data into actionable insights you can use without any technical training.
What Your Floor Lamp IES File’s Numbers Actually Mean for Your Space
You don’t need to be a lighting engineer to interpret the key numbers in a floor lamp IES file, you just need to know which metrics matter for your use case. The first value to check is total luminous flux, measured in lumens, which tells you the total light output of the fixture. For floor lamps, 300, 800 lumens is standard for ambient lighting, while 800, 1500 lumens works for task lighting like reading.
Next is beam angle, measured in degrees, which tells you how wide the light spread is. Narrow spot beams are 15, 30 degrees, perfect for highlighting a specific area, while wide flood beams are 90, 120 degrees, ideal for lighting an entire corner of a room. The cutoff angle is another critical metric: it’s the point where the lamp’s light drops to less than 10% of its maximum intensity, which directly correlates to glare.
A cutoff angle of 45 degrees or higher means you won’t get a bright glare in your eyes when you’re seated.
The accompanying image shows how these metrics translate to real spatial coverage, with measured light footprints for three common floor lamp beam types at standard 5-foot mounting heights. If you’re using the lamp for reading, look for a beam angle between 40, 60 degrees and a cutoff angle above 45 degrees to avoid reading-related eye strain. For ambient lighting in a living room, a wider 90, 120 degree flood beam with no harsh cutoff will spread light evenly across the space.
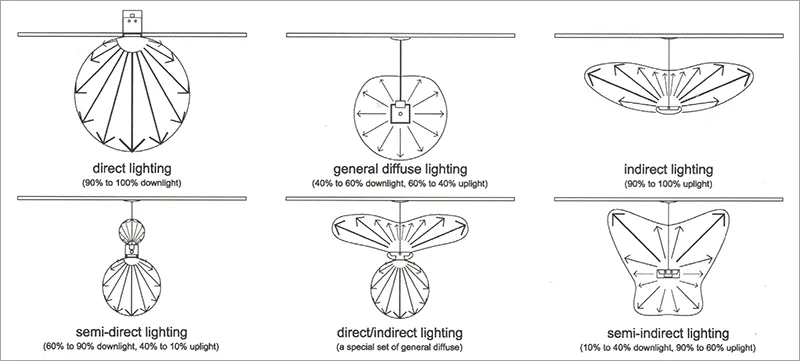
Image source: Web (Bing) / manufacturer.lighting (Web image (fair-use with source credit))
Some IES files also include correlated color temperature (CCT) and color rendering index (CRI) metadata. CCT measured in Kelvin tells you if the light is warm (2700K, cozy) or cool (4000K, task-focused), while CRI (80, 100) tells you how accurately colors look under the lamp. For reading, a CRI of 90 or higher is ideal to avoid eye strain from washed-out text.
4 Common Floor Lamp IES File Mistakes That Waste Money and Cause Bad Lighting
Even when you have access to a floor lamp IES file, it’s easy to misinterpret the data and end up with a lamp that doesn’t work for your space. The four most common mistakes we see in user feedback and designer reviews are:
- Ignoring mounting height metadata. IES files are calibrated for a specific mounting height, usually 5 feet for floor lamps. If you place the lamp higher or lower than that, the beam spread and brightness will shift drastically, often making the light too dim or too harsh.
- Comparing total lumens only. Two floor lamps can both have 1000 lumens, but one might have a narrow spot beam that only lights a small area, while the other has a wide flood beam that lights an entire room. Total lumens don’t tell you anything about distribution, so you’ll end up with the wrong lamp if you only look at that number.
- Using outdated IES file versions. Older IES v1.0 files sometimes lack metadata or have formatting issues that cause free lighting software to misread the data. As of 2026, most modern tools work best with TM-27 XML format files, which are more structured and accurate.
- Forgetting to account for room reflectance. IES file simulations assume standard room surfaces, but if you have dark walls or a low-pile carpet, the light will absorb faster than the simulation predicts, making the lamp feel dimmer than the IES data suggests.
If you ignore mounting height metadata, you might end up with uneven light coverage across your space.
How to Compare Two Floor Lamps Using Their IES Files (No Guesswork Required)
Comparing two floor lamps side by side using their IES files is far more reliable than reading marketing spec sheets, because you’re looking at actual measured performance data instead of curated claims. For official guidance on IES file formatting standards, refer to the Illuminating Engineering Society’s photometric data resources.
The fastest way to do this is to import both IES files into a free lighting design tool like Dialux or the open-source LuxRender. First, align both fixtures to the same mounting height and orientation in the simulation space, usually 5 feet for a standard floor lamp next to a seating area. Then, generate the candela distribution plot and light footprint for each lamp at the same brightness level.
Look for three key differences: total lit area at your target task distance (like 3 feet from a reading chair), average illuminance (measured in lux) on that task area, and any glare hotspots above 10,000 candela that would cause discomfort. For example, a 800-lumen narrow spot floor lamp might deliver 500 lux on a small 1-foot diameter reading area, while an 800-lumen wide flood lamp might only deliver 150 lux across a 4-foot area. If you need focused task light for reading, the narrow spot is the better pick.
If you want to light an entire corner of the room, the wide flood wins. You can also use the isocandela contours to see which lamp spreads light more evenly across the space, avoiding the dark spots that make a room feel dim even with a high-lumen fixture. If you’re worried about glare, check the cutoff angle for each lamp, and prioritize models with angles above 45 degrees to avoid glare-related discomfort while seated.
Step-by-Step: Simulate a Floor Lamp’s Performance in Your Room With Its IES File
You don’t need a degree in lighting engineering to test a floor lamp’s real-world performance with its IES file. Free residential design tools like Dialux and ReluxDesktop let you run accurate simulations in 10 minutes or less. The standard workflow for this process is shown below, and it works for any room layout you can measure.
Image source: Web (Bing) / luminaires.dialux.com (Web image (fair-use with source credit))
First, locate the IES file for the floor lamp you’re testing. Premium brands list these files directly on product specification pages, or you can request them from customer support if they’re not published. If a brand refuses to share the file, that’s a reliable sign their marketing claims won’t hold up in real use.
Next, download a free simulation tool. Dialux 8 is free for non-commercial use, and it accepts all standard IES file formats including TM-27 XML. Input your room’s exact dimensions, ceiling height, and surface reflectances: light-colored walls are ~80% reflectance, dark walls are ~20%, and polished hardwood is ~40% while low-pile carpet is ~15%.
Place the floor lamp model in the virtual room at the exact height and position you plan to install it, usually 5 to 6 feet high for a reading nook or 7 feet for ambient living room lighting. Run the simulation, then check the three key outputs: illuminance (measured in lux) on your task area, the light footprint diagram, and the glare heatmap.
For reading, aim for 300 to 500 lux on the seat of your chair. For ambient lighting, 100 to 200 lux across the room is sufficient. If you see glare hotspots over 10,000 candela in the seating area, adjust the lamp’s tilt or move it 1 to 2 feet sideways to eliminate discomfort, or swap in a different floor lamp’s IES file to compare coverage side by side without buying either fixture.
If your simulation shows insufficient lux on your task area, you may need a higher-lumen fixture, or you can troubleshoot underperformance with these easy fixes for dull floor lamp output.
Floor Lamp IES File FAQs
Do all floor lamps have IES files?
No, only premium and commercial-grade floor lamps typically include IES files. The LM-79 standardized photometric testing required to generate them adds production costs that budget brands often skip. If a manufacturer doesn’t publish an IES file for a floor lamp, you can’t verify its claimed brightness or beam spread independently.
Can I use an IES file for a floor lamp in any lighting design software?
Most modern lighting design tools support standard IES files, but older IES v1.0 files may have formatting issues with free or entry-level software. As of 2026, TM-27 XML format files are the most widely compatible across tools like Dialux, Relux, and online simulators. Always check the software’s supported file formats before importing.
What’s the difference between an IES file and a candela plot for a floor lamp?
A candela plot is a visual graph generated from an IES file’s raw data. The IES file contains the full, raw candela values for every angle the floor lamp emits light, which lets you run custom simulations. A standalone candela plot is just a pre-made visual, with no raw data for tailored testing.
Do I need an IES file to choose a floor lamp for my home?
No, it’s not required for casual shoppers, but it eliminates a lot of guesswork. If you’re buying a basic ambient floor lamp for a bedroom, spec sheet lumens and beam angle claims are usually enough. If you’re buying a task lamp for reading or a high-end fixture for a designed space, an IES file lets you verify performance before you buy.
Can I create an IES file for my existing floor lamp?
Yes, but it’s rarely cost-effective for residential users. Generating a valid IES file requires LM-79 photometric testing in a calibrated goniophotometer, which costs hundreds of dollars per test. It’s only practical for manufacturers or commercial lighting designers working on large projects.